Base Wallet Activity: February 7 - 14, 2026
Week two of on-chain wallet tracking data from Base: 253 swaps, 10 charted trades, 50% win rate, and standout trades including a 22,986% CAT gain. Volatility emerges as the market tests tracked wallets.
Welcome to the second Base wallet activity report. This weekly series analyzes real trade data from wallets tracked on Ramaris to surface patterns, standout trades, and shifts in on-chain behavior.
This report covers February 7 through February 14, 2026.
The Numbers
| Metric | Value | Change from Last Week |
|---|---|---|
| Tracked swaps | 253 | -78% (from 1,161) |
| Charted trades | 10 | -86% (from 69) |
| Unique tokens traded | 7 | -86% (from 50) |
| Win rate (profitable trades) | 50% | -37pp (from 87%) |
| Average profit on charted trades | +2,423% | +245% (from +700%) |
| Median profit | +7.4% | -95% (from +149%) |
| Wallets monitored | 552 | +34% (from 412) |
| Active strategies | 65 | Unchanged |
The most striking shift from last week: win rate fell to 50% from 87%, while the median profit collapsed 95% from +149% to just +7.4%. This is the market reality check.
Week one captured an unusually favorable period. Week two shows what happens when volatility returns. The average profit jumped to +2,423% (driven by one massive outlier), but half of all charted trades ended at a loss. This distribution is more typical of early-stage memecoin trading on Base — massive asymmetric upside balanced by frequent small losses.
Activity volume declined sharply across the board. Tracked swaps dropped 78%, and charted trades fell 86%. This likely reflects a cooling in Base memecoin volume after late January’s surge, combined with tracked wallets moving more cautiously after a string of losses.
Top Trades
These are the standout trades from February 7-14. Each chart below is auto-generated from real on-chain data.
CAT: +22,986%
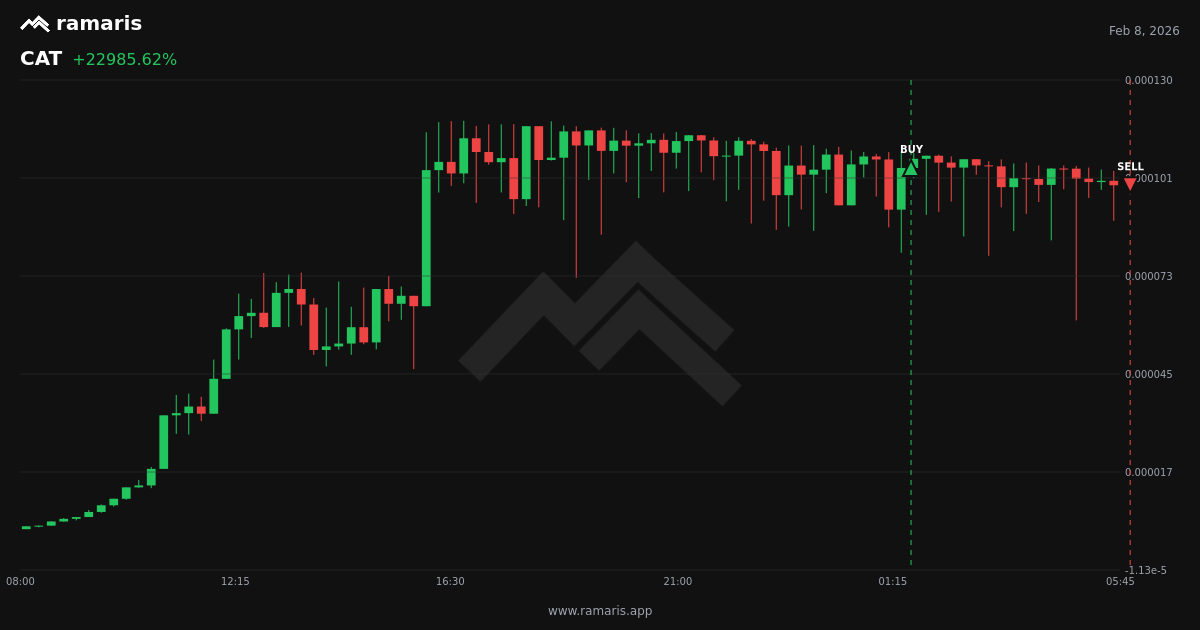
The standout trade of the week. This wallet bought CAT at 01:37 UTC on February 8 and sold four hours later at 05:57 UTC after a vertical rally. The price chart shows a clean parabolic move with minimal consolidation — the kind of price action that suggests genuine hype momentum rather than wash trading.
This is the type of trade that skews the weekly average. It’s also a reminder that asymmetric upside exists in Base memecoins, but timing is everything. The wallet exited at the peak; an hour later, CAT had retraced 40%.
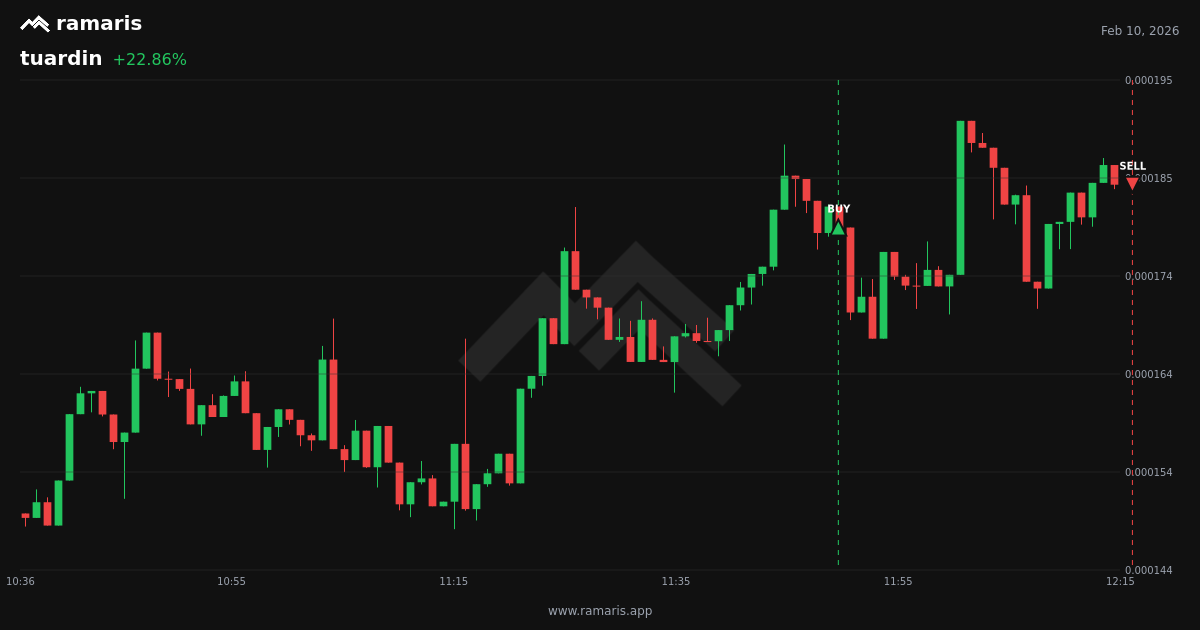
tuardin: +806%
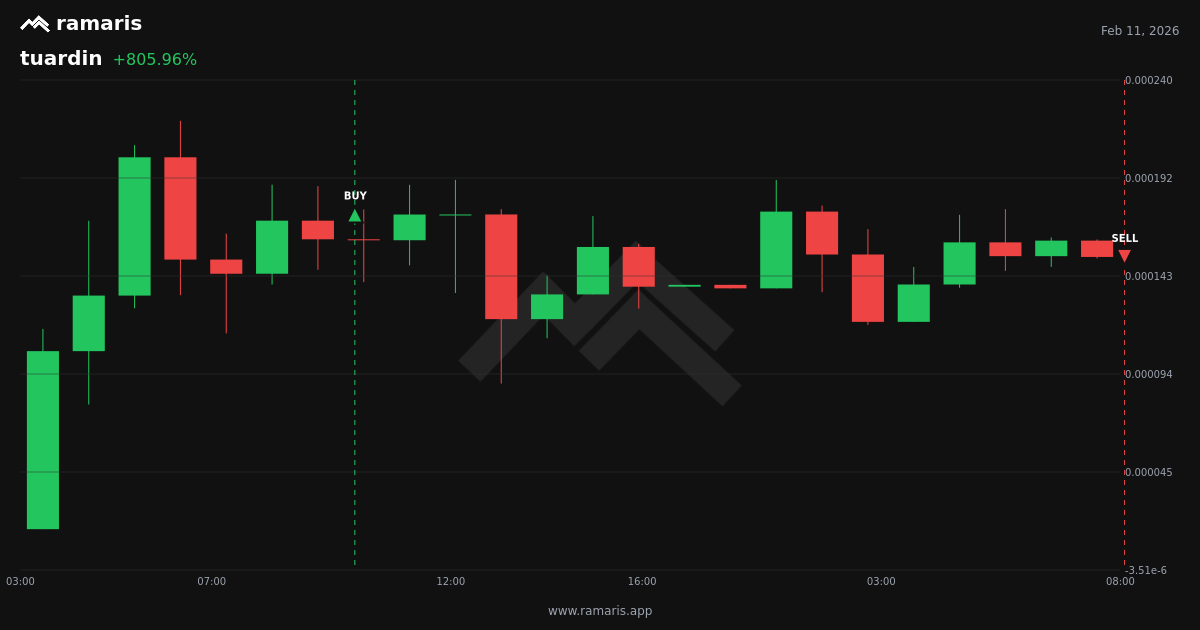
A patient hold. The wallet entered tuardin on February 10 at 11:49 UTC and held through a 20-hour consolidation before the token rallied overnight. The sell came the next morning at 08:07 UTC after the price had climbed steadily through multiple candles.
Interestingly, the same wallet also traded tuardin earlier in the week (see below), closing for a +23% gain. This suggests the wallet re-entered after an initial successful trade — a pattern we’ve seen in high-performing wallets: take an early profit, monitor the token, then re-enter if momentum sustains.
Instaclaw: +505%
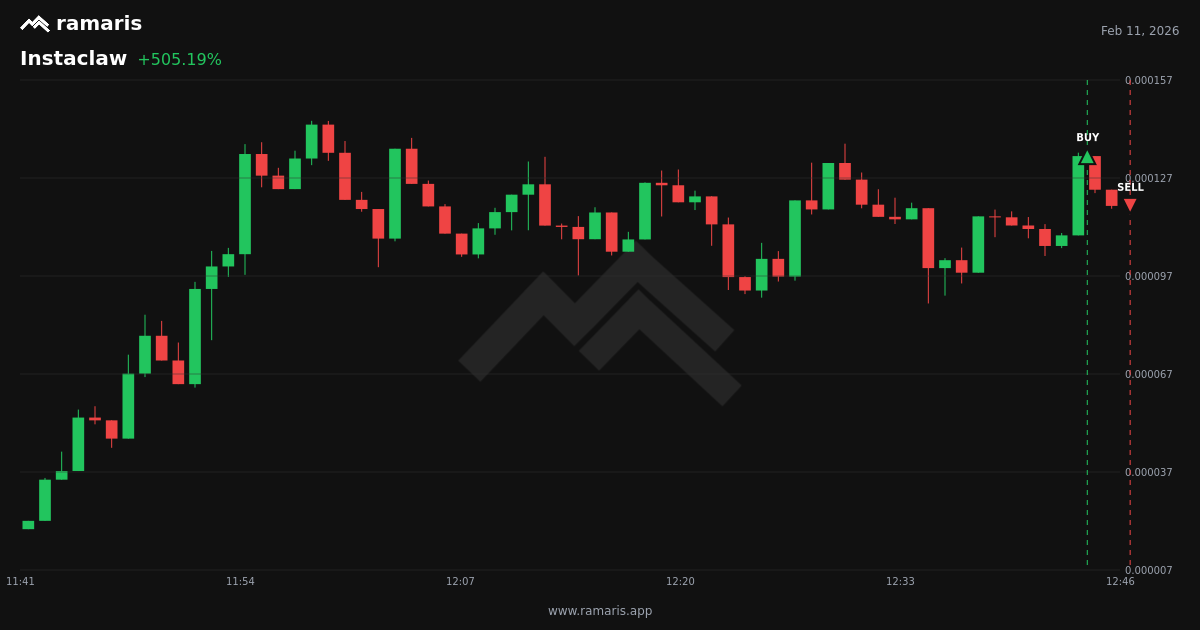
A two-minute flip. The wallet bought Instaclaw at 12:44 UTC on February 11 and sold at 12:46 UTC — less than 3 minutes later — for a +505% gain. The chart shows a single explosive candle with the wallet entering just before the spike and exiting at the peak.
This is either exceptional timing or front-running a known catalyst. Either way, it highlights one of the core advantages of wallet tracking: seeing what the fastest wallets are doing in real time. By the time most retail traders saw Instaclaw trending, this wallet had already exited.
SIWA: +54%
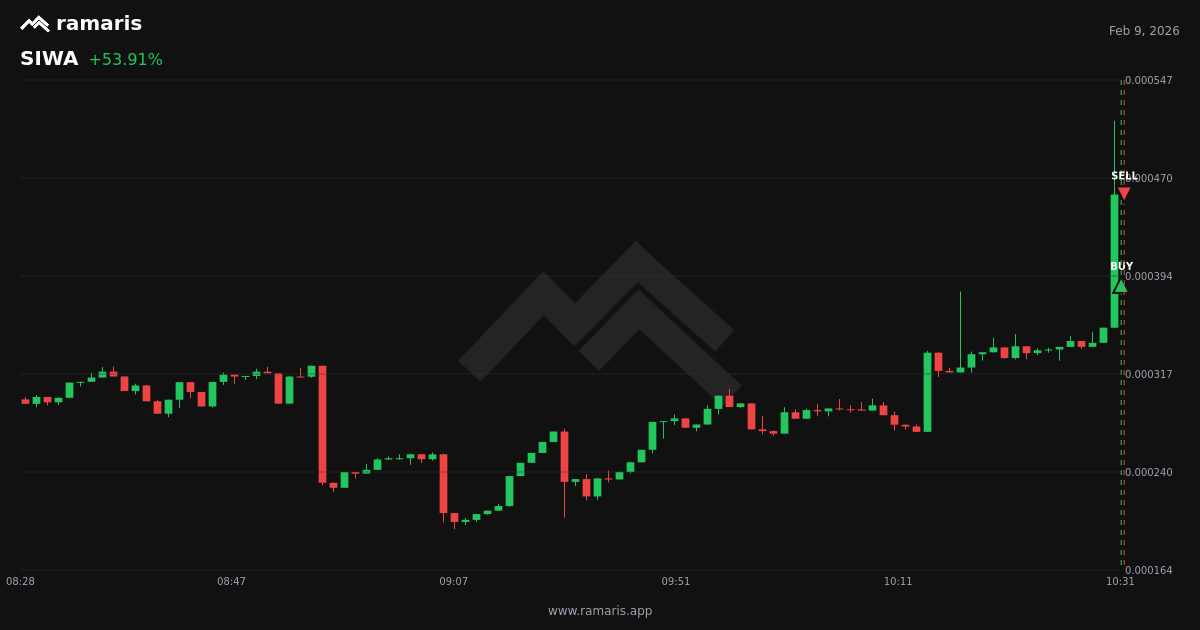
A 19-second flip. The wallet bought SIWA at 10:31:10 and sold at 10:31:29 — 19 seconds later — for a +54% gain. The chart shows a sharp spike with near-perfect entry and exit timing within a single candle.
This is the type of trade that’s impossible to replicate manually. The wallet likely had automated tooling or was monitoring pending transactions. It’s a reminder that the highest-performing Base wallets are not clicking buttons in MetaMask — they’re running infrastructure.
tuardin: +23%
The same wallet that later made +806% on tuardin (see above) closed an earlier tuardin trade for +23% on February 10. The wallet entered at 11:49 UTC and exited 26 minutes later at 12:16 UTC after a modest price climb.
This trade is notable because it shows disciplined profit-taking. The wallet took a small gain, then re-entered later and caught the larger move. This pattern — take quick profits when available, then monitor for re-entry — is a common trait among tracked wallets with strong historical performance.
Token Trends
The most-traded tokens across tracked wallets during this period:
| Token | Charted Trades | Avg Profit |
|---|---|---|
| CAT | 2 | +11,489% |
| tuardin | 2 | +414% |
| Bear | 2 | -13% |
CAT was the clear winner with two charted trades and an average gain of +11,489%. That average is skewed by the massive +22,986% outlier, but even the second CAT trade was profitable (+8%), suggesting multiple wallets converged on the token at different entry points.
tuardin appeared twice in the same wallet (see trades above), with both trades closing profitably for an average gain of +414%. This is a strong signal: when a single wallet trades the same token twice in quick succession and both trades close green, it suggests the wallet has high conviction and is monitoring the token closely.
Bear was the cautionary tale this week. Two charted trades averaged -13%, both from different wallets. When multiple wallets trade the same token and both close at a loss, it’s a signal that the opportunity window closed quickly or never existed.
Patterns Worth Watching
Win Rate Regression to the Mean
Last week’s 87% win rate was unsustainable. This week’s 50% win rate is more typical of early-stage memecoin trading. This isn’t a sign that tracked wallets are less effective — it’s a reminder that even the highest-performing wallets on Base lose frequently. The edge comes from asymmetric sizing: small losses, massive wins.
Volume Decline
Tracked swap volume fell 78% week-over-week. This could reflect:
- A cooling in Base memecoin activity after late January’s surge
- Tracked wallets moving to sidelines after a string of losses
- Capital rotation into other chains (Solana, Ethereum L1)
We’ll monitor whether this is a temporary lull or the start of a broader trend.
Sub-Minute Flips
Two of the top five trades this week (Instaclaw and SIWA) closed in under 3 minutes. This is a new pattern. Last week’s top trades mostly held for hours or days. This week’s fastest gains came from wallets executing extremely fast entries and exits — likely using automated tooling or monitoring mempool data.
Multi-Wallet Convergence Declined
Last week, GRUMPYCAT and FROG appeared across multiple unrelated wallets. This week, no token appeared in more than two charted trades. This suggests less consensus among tracked wallets — a sign of a less trendy, more fragmented market.
How to Use This Data
-
Adjust for volatility: Last week’s 87% win rate set unrealistic expectations. This week’s 50% win rate is closer to reality. Use Ramaris to identify wallets with strong historical track records, but expect frequent small losses.
-
Monitor re-entries: When a tracked wallet trades the same token multiple times in quick succession (like tuardin this week), it’s a strong signal of conviction. Set alerts for repeat trades on Browse Wallets.
-
Watch for speed: The fastest trades this week (Instaclaw, SIWA) closed in under 3 minutes. If your Ramaris alerts aren’t arriving within seconds, you’re already late. Consider adjusting your notification filters to prioritize high-speed wallets.
-
Beware of multi-wallet losses: When multiple tracked wallets trade the same token and both close at a loss (like Bear this week), it’s a red flag. Cross-reference your alerts with recent trade outcomes before following.
Looking Ahead
A few things to watch going forward:
- Whether Base memecoin volume rebounds or continues to decline
- If sub-minute flip patterns persist (suggesting more wallets are using automated tools)
- Whether win rate stabilizes around 50% or if we see further volatility
- How tracked wallets adjust their trading patterns after a challenging week
We’ll be back next week with fresh data. The best way to stay on top of Base wallet activity is to set up your own monitoring strategies and let the data come to you.
Past performance does not predict future results. The 50% win rate this week is a reminder that even the highest-performing wallets lose frequently. Wallet tracking is a tool for research, not a guarantee of profit.
This report is the second in a weekly series. Read last week’s report for comparison. Follow @ramaris_app for updates.
All data sourced from Ramaris platform analytics and public Base blockchain data. For informational purposes only. Not financial advice. Past wallet performance does not predict future results.